The construction of the supporting database, data assimilation, and visualization system includes:
1. Data assimilation subsystem
2. Observation and simulation experiment subsystem
3. Satellite key parameters inversion subsystem
4. Data fusion subsystem
5. Database integral support subsystem
6. Data visualization subsystem
Subsystem 1: Data assimilation subsystem
This system obtains large amounts of conventional observation data and meteorological satellite data over China, using advanced variational and ensemble data assimilation methods for the development of the data assimilation system, to construct a supporting database and analysis of data sharing, and provide efficient support for petascale computing visualization tools and visualization technology for devices. The databases, data assimilation and visualization systems provide high-precision, high-resolution input data and validation data for global-scale earth system models and regional high-precision environmental simulations.
Subsystem 2: Observation and simulation experiment
On the one hand, the subsystem of the observation system for simulation experiments carries out bias correction through the real-time monitoring and evaluation of the in-orbit instruments on satellites. In addition, it helps to establish the classified quality identifications of the observation data and radiative transfer model, effectively supporting the pre-processing of remote sensing data for the assimilation system of the atmosphere, ocean, and terrestrial surface, as well as the numerical simulation system. On the other hand, the subsystem also builds a simulation system based on the requirements for designing new loads. It simulates preprocessed data products to obtain optimal in-orbit parameters of instruments, through simulation performance tests, in order to provide a basis and essential parameters for the product algorithm, assist in the joint debugging of the ground system, and offer scientific references, and a basis for such issues as the constellation layout and payload update of the subsequently launched satellites.
Subsystem 3: Satellite key parameters inversion subsystem
This subsystem will use our FY geostationary and polar-orbiting meteorological satellite data. With the rigorous quality control of the observation data, the advanced inversion algorithm is adopted to establish a real-time data processing and retrieval system for geostationary and polar-orbiting meteorological satellites.
This system is capable of efficiently and regularly receiving, processing, and inverting key atmospheric parameters with high-accuracy and high-resolution, such as temperature, humidity, and cloud parameters, in order to enable the inversion precision to reach an advanced international level and provide real-time satellite data to test the simulation results for the whole system. Moreover, it reprocesses the long-term sequence data of historical satellites to obtain consistent and reliable data (level 1), which are used to obtain key atmospheric parameters that have significant effects on weather and climate, such as cloud, aerosol, and atmospheric precipitation.
The acquisition of these parameters can provide an input field for the earth system model, deepen our understanding of weather process, and provide observational facts for testing and improving the earth system model.

Figure 1. FY3C/MERSI RGB true color image
Subsystem 4: Data fusion subsystem
With the rapid development of meteorological observation systems, the amount of observational data derived from automatic observation stations, radars and satellites has been increasing. Meanwhile, the quality of simulation data has also been improving, with temporally and spatially continuous meteorological data products becoming ever better. The standard of the formative spatial continuous meteorological data products is in general much higher now. Using data fusion and assimilation technology is deemed an effective method to yield multi-source data fusion meteorological grid products with high-precision, high-quality, and spatial continuity by synthesizing multi-source observation data and multi-mode simulation data.
The vital point of multi-source product data fusion technology is to obtain station observations, satellite, radar, and other remote sensing data, as well as a spatiotemporal matching technique between observation data with different resolutions, the systematic deviation revised technology between multi-source observations, and fusion and analysis technology for multi-source observation data. There have been many achievements regarding data fusion meteorological grid products, and this technology has been widely used all over the world in many fields.
Subsystem 5: Database integral support subsystem

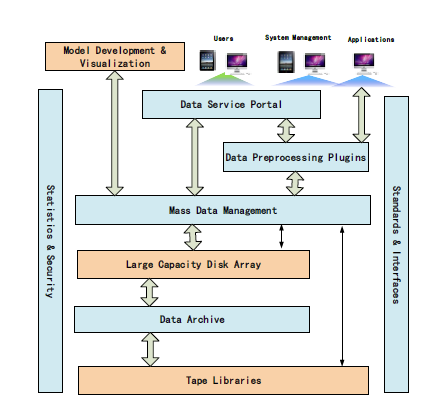
Figure 2. Functions of database integral support subsystem
By integrating and managing observation data and model data products, the Database Support System (DSS) will build an earth data repository to ensure successfulfulfilment of the project. SDS is closely associated with other systems. It provides input data for each system and gathers the data products developed by them. DSS consists of three main parts: the massive data management subsystem, which collects data, manages data, and provides data service interfaces; the high-resolution remote sensing data product preprocessing subsystem, which develops preprocessing plugins and remote sensing data products; and the data service portal subsystem, which provides a unified portal of data products and services.
Subsystem 6: Visualization subsystem
The visualization subsystem (VS) is a visual analysis platform in the earth numerical simulator. It will combine advanced hardware equipment, intelligent interactive technology, visualization technology, and virtual reality technology to realize the visual analysis and display of the simulation output data from the earth system. It will also underpin the discovery of new scientific phenomena and mechanisms for scientists. Furthermore, VS is a comprehensive visualization platform for earth system science, which combines various advanced hardware and software and assists in data-visualized analysis and presentation for the entire earth system simulator. VS is equipped with professional graphics processors and high-speed networks, which provides high-quality hardware support for massive data visualizations.
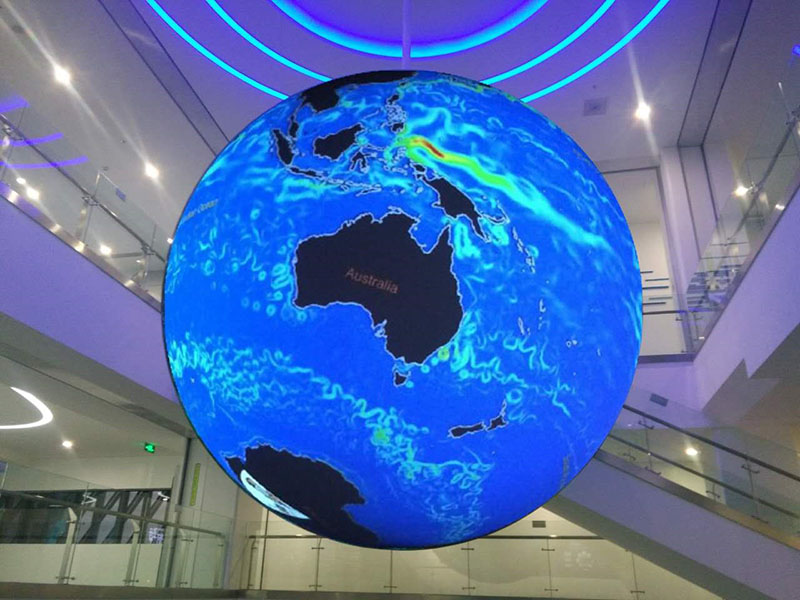
The core software of VS provides parallel, advanced visualization, and interaction supports according to various visualization requirements of the earth system modes. The visualization results will be represented and explored in the high-resolution large-screen system, spherical display system, and virtual reality terminals, achieving efficient visual analysis of the earth system scientific data.

Figure 3. Sketch map of spherical display screen